
Understanding Reporting and Reporting FAQs
Our reporting tools offer valuable insights in to the performance of your advertisements, allowing you to gauge their effectiveness and make informed decisions.
Dashboard Overview
Upon accessing the dashboard, you'll see a summary of key metrics, your top 10 performing books, and a graph representing the trends of your ad performance.
You can filter these results by market place, data source, and by date range.

Filter by Data Source
- All: Shows both existing Amazon campaigns as well as ads created in Publishing Performance
- Publishing Performance: Ads created and managed by Publishing Performance
- Amazon Advertising: Ads created directly in Amazon Advertising portal. These can not be managed in Publishing Performance and are purely for reporting purposes.
Key Metrics
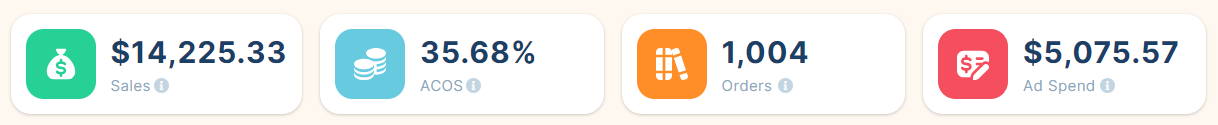
- Sales represents the total amount of money generated from sales before any expenses are subtracted. It is calculated by multiplying the number of units sold by the price per unit.
- ACOS is a key metric used to measure the efficiency of an Amazon PPC campaign. It represents the percentage of direct sales generated from PPC advertising relative to the cost of those ads. Calculated as (Ad Spend ÷ Sales) × 100, a lower ACOS indicates a more cost-effective advertising campaign. Learn more about Amazon Advertising terminology here.
- Orders reflects the total count of your book copies purchased by customers through your advertisements. This metric exclusively tracks sales directly resulting from your advertising efforts and excludes any sales not linked to your ads.
- Ad Spend is the total amount of money spent on your advertisements in the selected time period.
Your Books
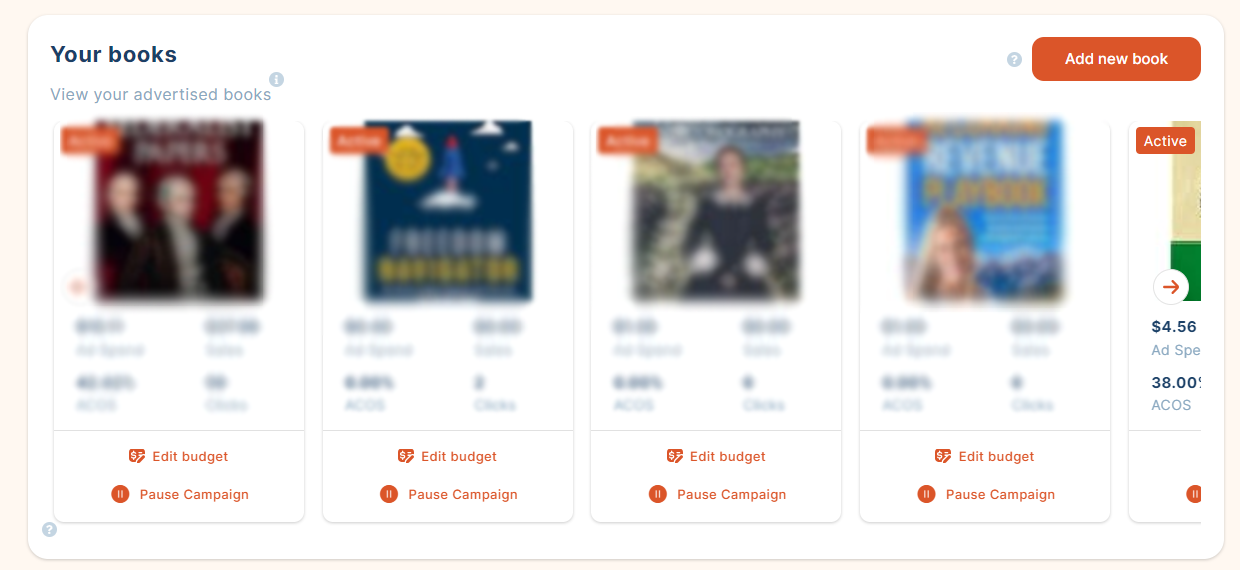
The Your Books section provides key metrics by book for your top 10 performing books.
Simply scroll using the arrows to view more results.
Graphs and Charts
Graph
At the bottom of your dashboard, you will see graph that allows you to visualize the trends and patterns of your ad performance.
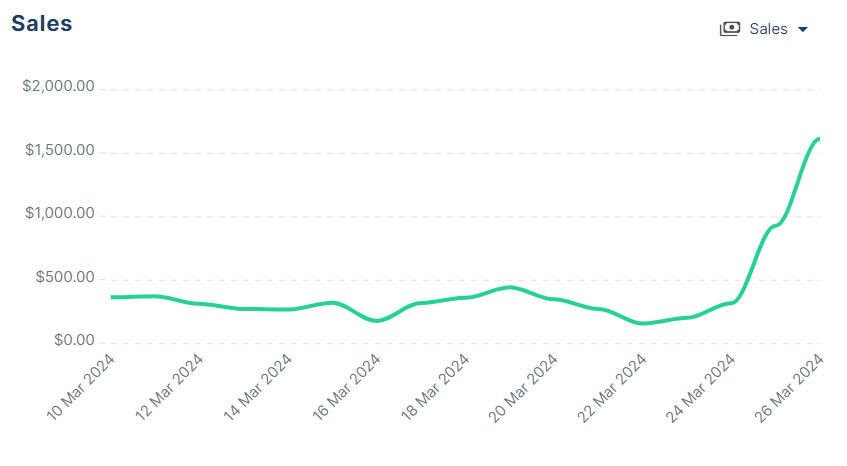
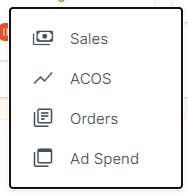
You can filter the graph to display any of the 4 key metrics using the dropdown in the top right hand corner of the graph..
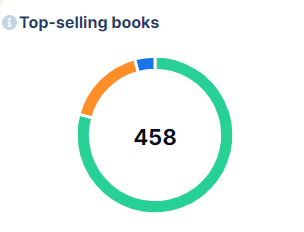
Pie Chart
The Top Selling Books pie chart displays your top 3 books ranked by orders/copies sold
My Books Page
The My Books page provides a detailed report on how each of your books are performing.
You can filter your date range in the top right hand corner.
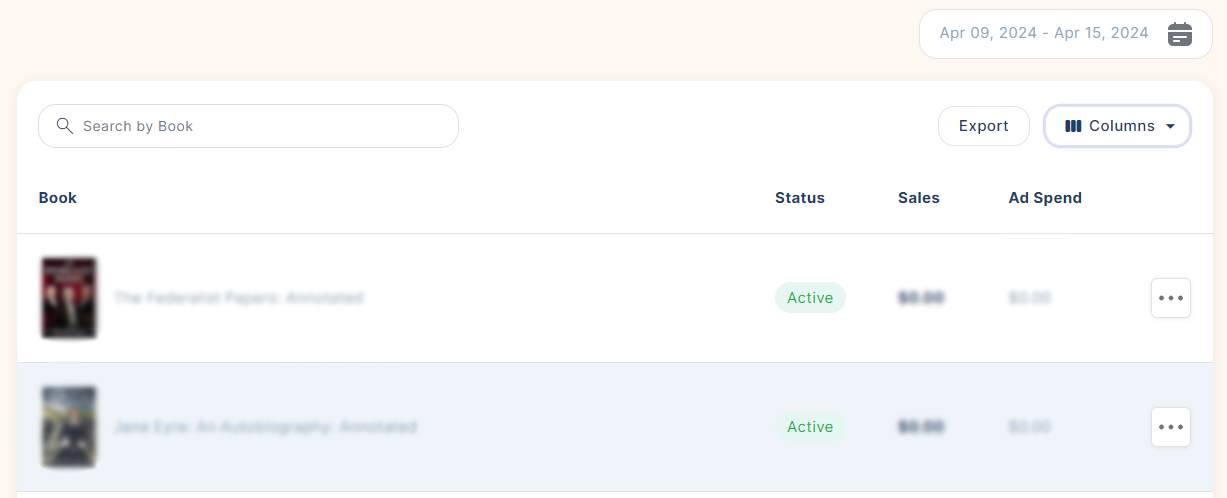
You can export your data by clicking the export button in the top right hand corner.
Table Fields
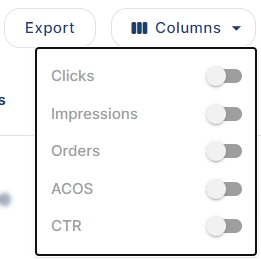
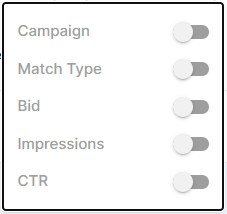
You can adjust which data is shown on the table by clicking the Columns dropdown and toggling on the key metrics that are important to you.
- Book: Displays the advertised book's cover image and title. Click through to explore detailed performance data, including keyword analytics
- Status: Indicates the current status of your advertisement. 'Active' means your ad is currently being displayed, while 'Paused' indicates it is not being shown to users.
- Sales: Total revenue generated from the advertisement (sales before any expenses are subtracted). This figure is derived from the total number of sales multiplied by the price of the book.
- Ad Spend: The total amount of money spent on this advertisement in the selected time period.
- Clicks: The total number of times users have clicked on the advertisement. Each click represents a potential customer's interest.
- Impressions: The number of times the advertisement was shown to users. This metric helps gauge the visibility of your ad.
- Orders: The total number of orders placed through this advertisement.
- ACOS is a key metric used to measure the efficiency of an Amazon PPC campaign. It represents the percentage of direct sales generated from PPC advertising relative to the cost of those ads. Calculated as (Ad Spend ÷ Sales) × 100, a lower ACOS indicates a more cost-effective advertising campaign.
- CTR (Click Through Rate): The percentage of impressions that resulted in a click. A higher CTR suggests that the advertisement is relevant and engaging to viewers.
Keyword Performance
From the My Books page, you can click on any book to get a more detailed breakdown on that books performance and the keywords that are driving sales.
Simply hover over any book and click.
Once you have clicked through, you will see each of the key metrics for your selected book at the top of the page. Along with the usual date filter.
The table below provides a break down of results by searches shoppers made prior to seeing your ad:
- Keyword: Displays the actual keyword shoppers searched before seeing your ad.
- Your ad is displayed to shoppers who have searched for specific keywords related to your book. Our AI continuously works to optimize keywords your ads target to get the most conversions possible.
- ASIN Same As: The ASIN shoppers viewed before seeing your ad.
- Your ad is displayed to shoppers who are viewing specific products related to yours. This field shows the ASINs of those products.
- Category Target: The category shoppers browsed before seeing your ad.
- Your ad is shown to shoppers who have browsed within a specific category relevant to your book. If your book falls under the "Self-Help" category, your ad could be displayed to users exploring books in that category.
- Close Match: Your ad reached shoppers who have used search terms very closely related to your book.
- This targets shoppers who have used search terms very closely related to your book. If your book is about dog training, your ad might pop up for someone who searched for "puppy obedience training."
- Loose Match: Your ad reached shoppers who have used search terms loosely connected to your book.
- Your ad reaches shoppers who have used search terms loosely connected to your book. Continuing with the dog training example, your ad might show up for someone who searched for "pet care tips."
- Substitutes: Products similar to yours that shoppers viewed before seeing your ad.
- Your ad is displayed to shoppers who have checked out products similar to yours. If your book is a thriller novel, your ad could appear for someone who has viewed other thrillers or mystery novels.
- Complements: Products that go well with your book and were viewed by shoppers before seeing your ad.
- Your ad appears to shoppers who have viewed products that go well with your book. For instance, if your book is about healthy cooking, your ad might show up for someone who has looked at kitchen utensils or recipe books.
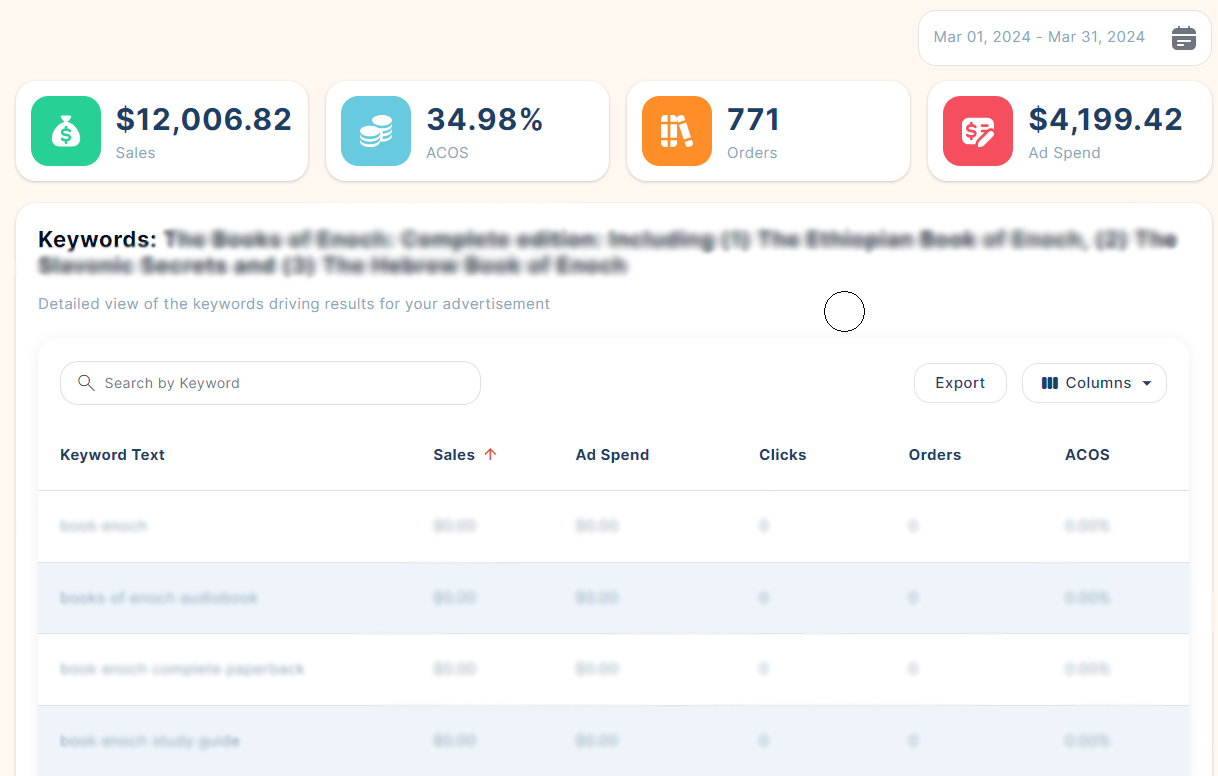
Table Fields
Just like the previous page, you can toggle which fields you would like to be shown on the table and export the data to csv.
- Keyword: Displays the keywords driving results for your ad campaigns. Each keyword's performance is tracked to show its effectiveness in attracting and engaging potential readers.
- Campaign: The names of all advertising campaigns associated with this book. Each campaign name represents a targeted strategy for reaching potential readers.
- Match Type: Specifies the precision level of keyword matching for your ads. 'Exact' match targets searches identical to your keywords, 'Phrase' includes your keywords within longer searches, and 'Broad' captures searches related to your keywords, offering varying degrees of targeting flexibility and reach. Learn more.
- Bid: The bid amount set for each keyword. Learn More.
- Sales: Total revenue generated from the advertisement (sales before any expenses are subtracted). This figure is derived from the total number of sales multiplied by the price of the book.
- Ad Spend: The total amount of money spent on this advertisement in the selected time period.
- Clicks: The total number of times users have clicked on the advertisement. Each click represents a potential customer's interest.
- Orders: The total number of orders placed through this advertisement.
- ACOS is a key metric used to measure the efficiency of an Amazon PPC campaign. It represents the percentage of direct sales generated from PPC advertising relative to the cost of those ads. Calculated as (Ad Spend ÷ Sales) × 100, a lower ACOS indicates a more cost-effective advertising campaign.
- Impressions: The number of times the advertisement was shown to users. This metric helps gauge the visibility of your ad.
- CTR (Click Through Rate): The percentage of impressions that resulted in a click. A higher CTR suggests that the advertisement is relevant and engaging to viewers.
Graphs
If you scroll to the bottom of the page you can also visualize your results on the trend graph.
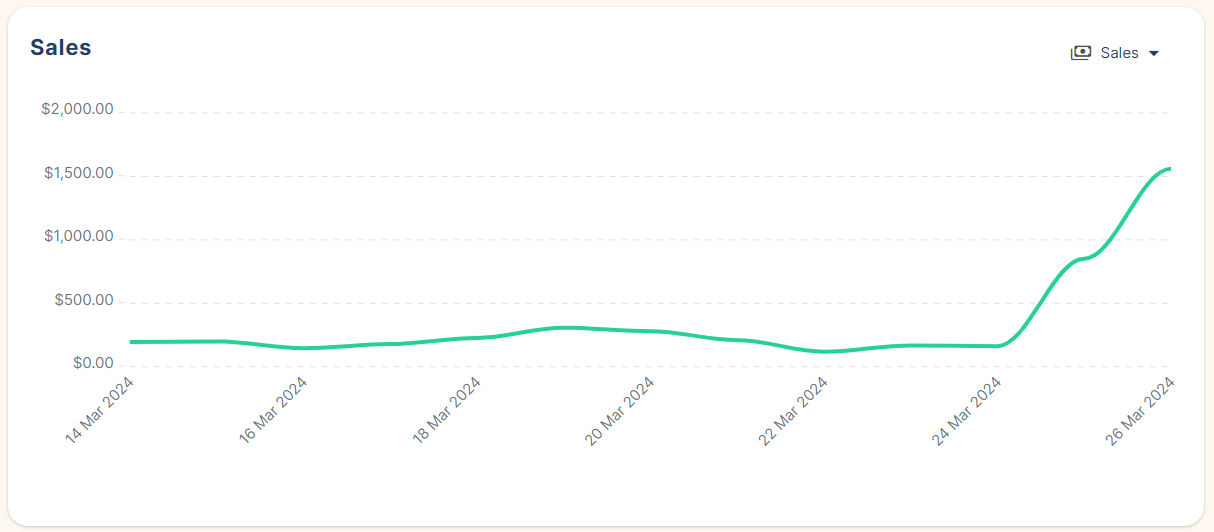
You can filter the graph to display any of the 4 key metrics using the dropdown in the top right hand corner of the graph.